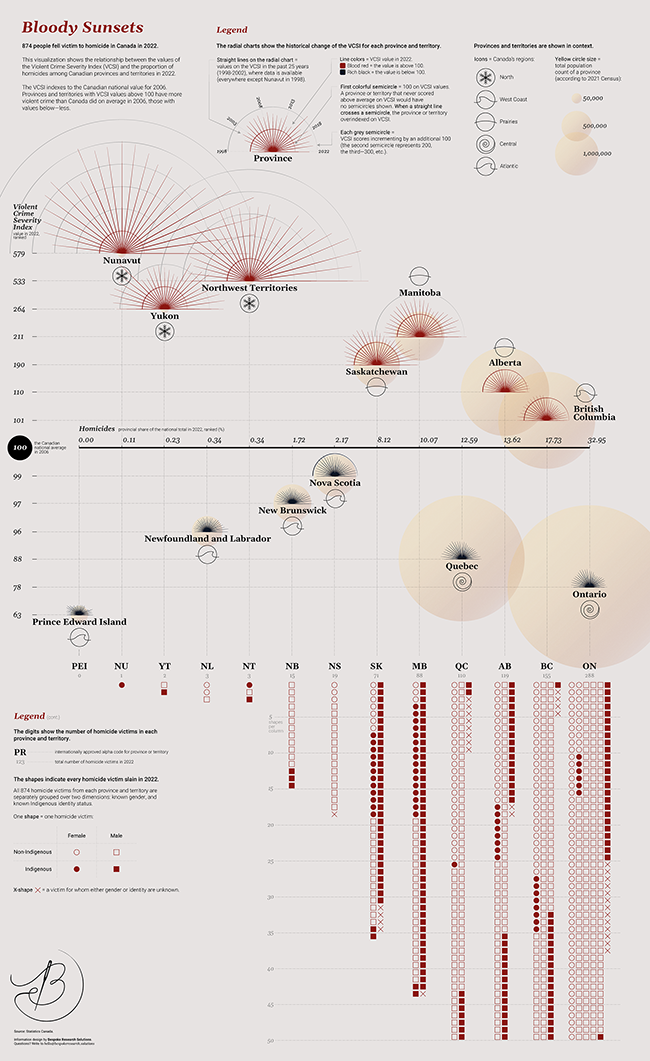
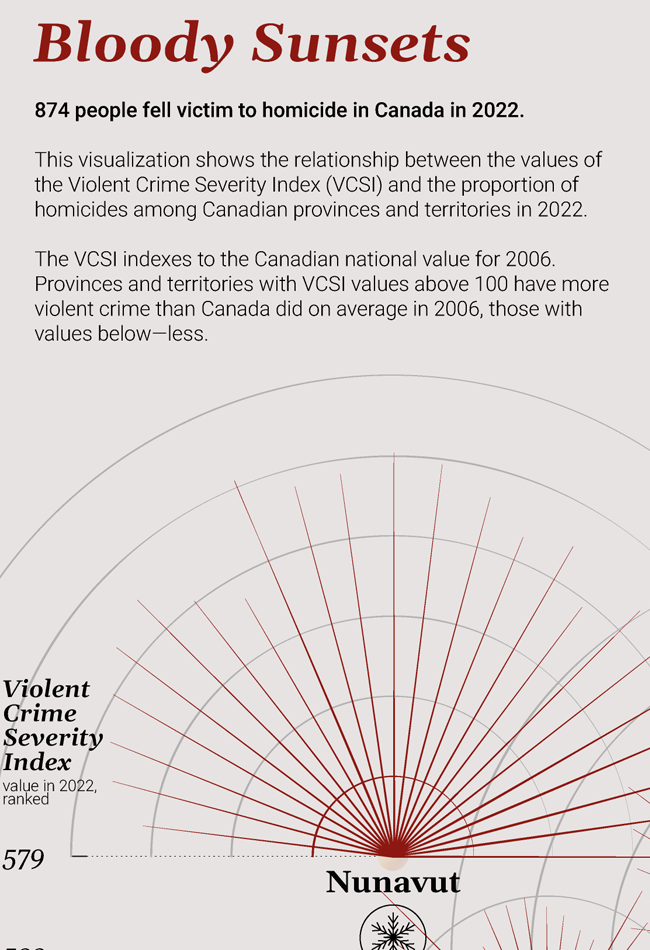
Bloody Sunsets
About the project
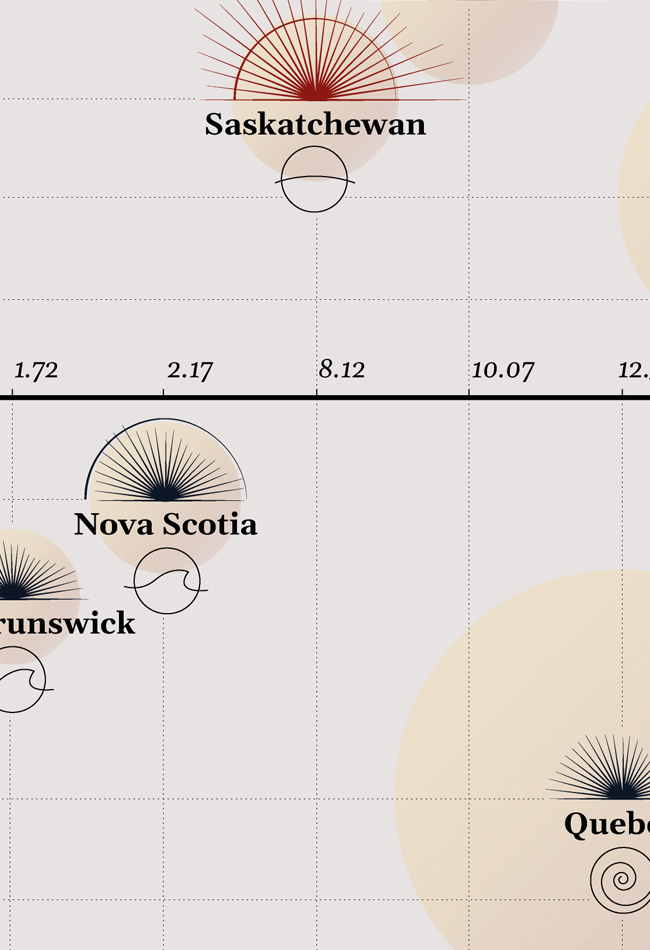
A re-imagining of two infographic series released by Statistics Canada (on homicide and police-reported crime), Bloody Sunsets visualizes the striking gap between the Violent Crime Severity Index and the actual numbers of homicide victims slain in Canada in 2022.
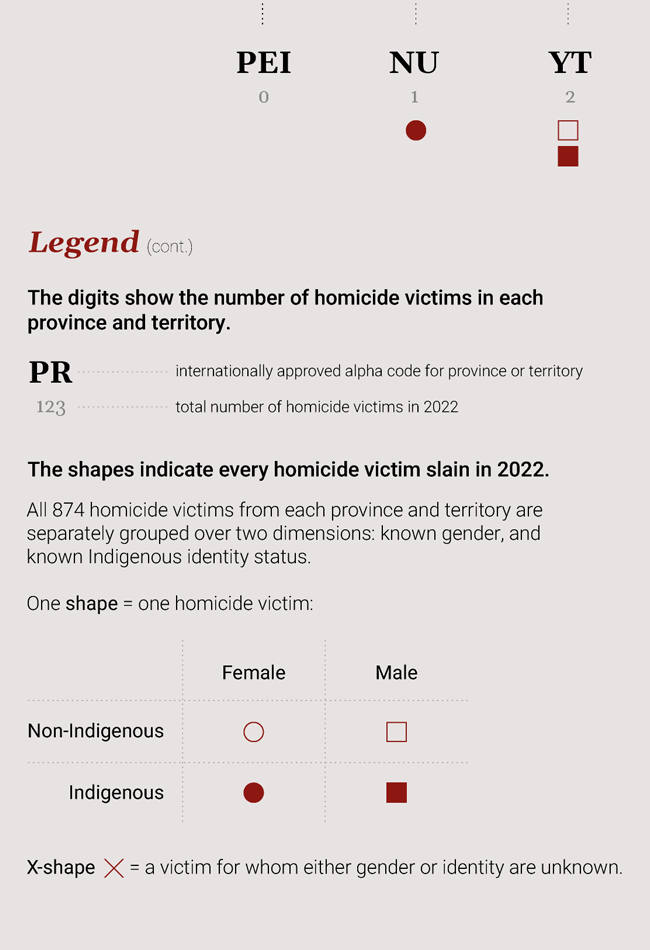
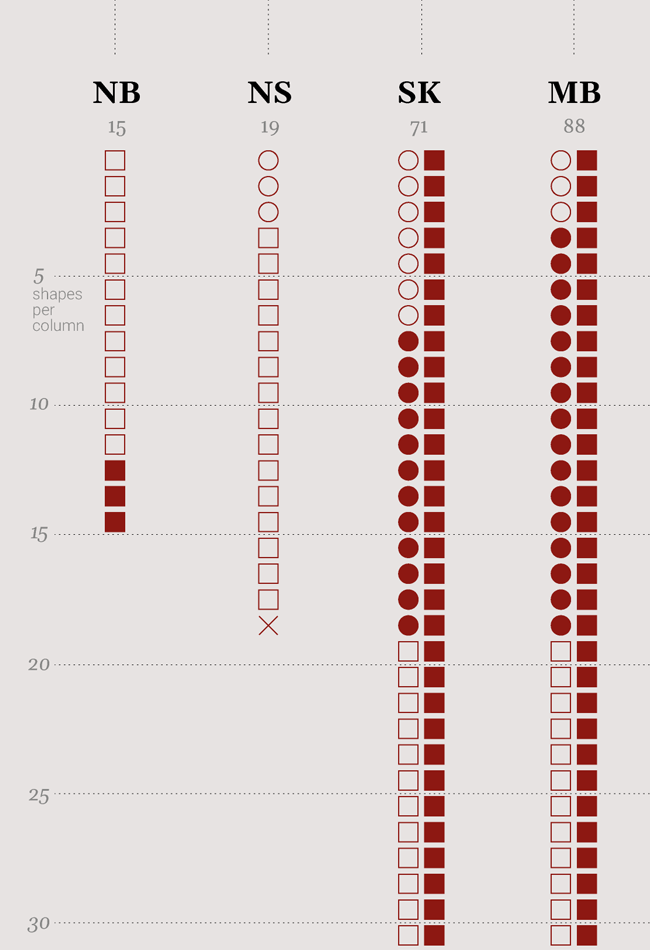
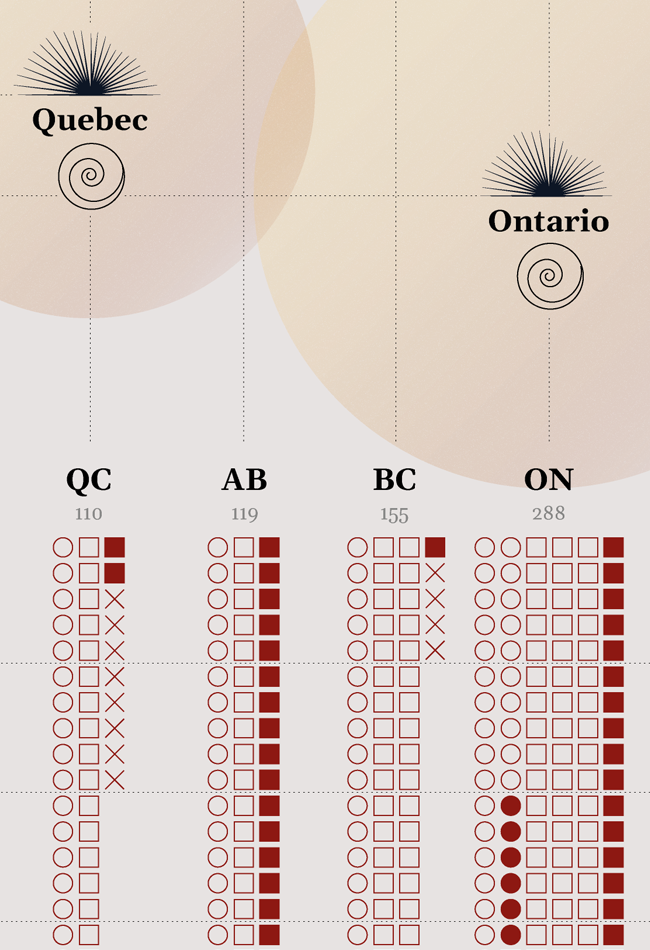
The first half of the infographic presents aggregated numbers. The second half adds a human dimension to the statistics by picturing every single victim. Rather than imposing a headline, the visual sparks curiosity and reflection.
Data source
Statistics Canada
Tools
Adobe Illustrator